
Economic Impact of TRS
Economic Impact of TRS
Distribution of Benefits Paid
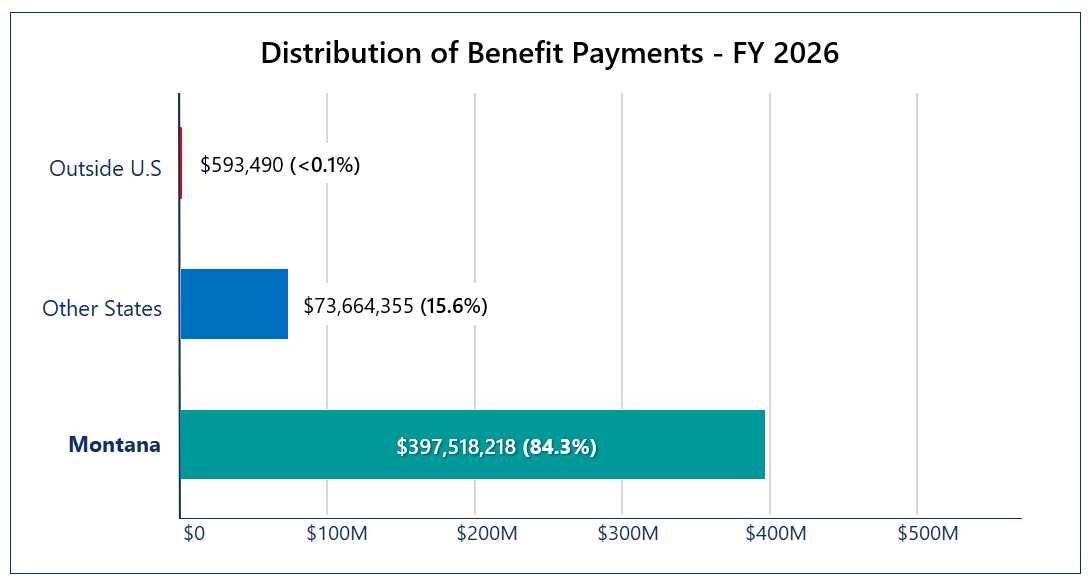
In Fiscal Year 2026, TRS distributed nearly $471 million in benefits. A large majority (84.3%) of those payments were made to retired members, survivors, and other eligible recipients residing right here in Montana.
These dollars flow right back into the state and local economy. A recent economic impact study found that each dollar paid out by Montana's public pensions generated approximately $1.47 in economic activity. (Source: National Institute on Retirement Security, Pensionomics 2025 – Montana)
Benefits Paid by Montana County
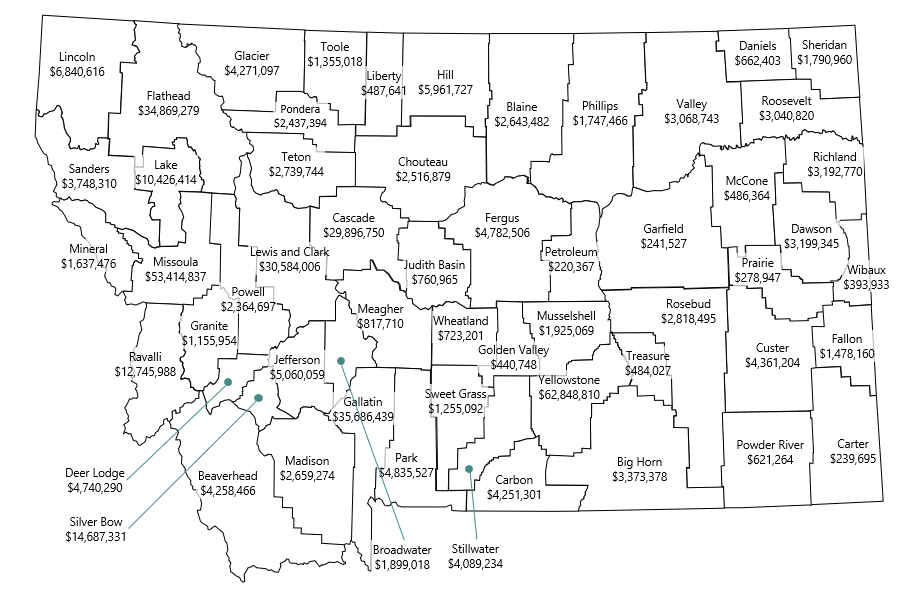
Benefits by County
| County | Benefits Paid |
|---|---|
| Beaverhead | $ 4,258,466.33 |
| Big Horn | $ 3,373,378.46 |
| Blaine | $ 2,643,482.00 |
| Broadwater | $ 1,899,018.27 |
| Carbon | $ 4,251,300.67 |
| Carter | $ 239,694.90 |
| Cascade | $ 29,896,749.94 |
| Chouteau | $ 2,516,879.40 |
| Custer | $ 4,361,203.92 |
| Daniels | $ 662,402.62 |
| Dawson | $ 3,199,345.49 |
| Deer Lodge | $ 4,740,289.89 |
| Fallon | $ 1,478,160.40 |
| Fergus | $ 4,782,506.47 |
| Flathead | $ 34,869,279.07 |
| Gallatin | $ 35,686,438.74 |
| Garfield | $ 241,527.27 |
| Glacier | $ 4,271,096.99 |
| Golden Valley | $ 440,747.70 |
| Granite | $ 1,155,954.27 |
| Hill | $ 5,961,726.90 |
| Jefferson | $ 5,060,059.20 |
| Judith Basin | $ 760,965.37 |
| Lake | $ 10,426,413.69 |
| Lewis And Clark | $ 30,584,005.79 |
| Liberty | $ 487,640.72 |
| Lincoln | $ 6,840,615.76 |
| Madison | $ 2,659,273.71 |
| McCone | $ 486,364.34 |
| Meagher | $ 817,709.82 |
| Mineral | $ 1,637,476.02 |
| Missoula | $ 53,414,837.16 |
| Musselshell | $ 1,925,068.68 |
| Park | $ 4,835,527.11 |
| Petroleum | $ 220,367.33 |
| Phillips | $ 1,747,466.36 |
| Pondera | $ 2,437,394.41 |
| Powder River | $ 621,264.34 |
| Powell | $ 2,364,696.64 |
| Prairie | $ 278,947.02 |
| Ravalli | $ 12,745,987.88 |
| Richland | $ 3,192,770.07 |
| Roosevelt | $ 3,040,819.62 |
| Rosebud | $ 2,818,494.76 |
| Sanders | $ 3,748,309.97 |
| Sheridan | $ 1,790,959.52 |
| Silver Bow | $ 14,687,330.93 |
| Stillwater | $ 4,089,234.02 |
| Sweet Grass | $ 1,255,092.25 |
| Teton | $ 2,739,743.77 |
| Toole | $ 1,355,017.76 |
| Treasure | $ 484,027.08 |
| Valley | $ 3,068,742.99 |
| Wheatland | $ 723,200.69 |
| Wibaux | $ 393,933.08 |
| Yellowstone | $ 62,848,810.15 |
| Total Recipients | Total Benefits Paid |
| 15,064 | $397,518,217.71 |